With the end of summer, and cooler weather returning to Xi’an, I thought it would be appropriate to finish our summertime series with a blog post about air pollution/air quality.


Without getting into too many specifics, I will try to give you all a good summary of what we (and the Chinese people) are dealing with… and hopefully offer a bit of encouragement too.
The encouragement: China is very much aware of the pollution problem and has been surprisingly transparent and open with the public about their failures and what their plans are to fix it. And although this isn’t something that can be fixed overnight, or even in the next 5 years, we have been encouraged by what we are seeing/hearing.
For now, we have taken steps as a family to do what we can to keep our lungs healthy, while still not shying away from living life here. We have five air purifiers that we run while we’re home, and a monitor that measures pollution levels in the air.


Here are a couple of need-to-know definitions I copied from the web…
Air Quality Index (AQI) – is a number used by government agencies to communicate to the public how polluted the air currently is. 0-50 is good. 51-100 is moderate. 101-150 is unhealthy for sensitive groups. 151-200 is unhealthy. 201-300 is very unhealthy. 301-500 is hazardous.
PM 2.5 – Fine particulate matter (PM2.5) is an air pollutant that is a concern for people’s health when levels in air are high. PM2.5 are tiny particles in the air that reduce visibility and cause the air to appear hazy when levels are elevated. These particles are the real bad guys and what I keep an eye on the most. Any reading greater than 12 is considered unhealthy.
Xi’an’s AQI average for this past year is 150 and ranked the 33rd most polluted city in the WORLD (#21 in China). By the way, Beijing’s AQI was 139 and ranks number 68.
Our first day that averaged in the “good” range (less than 50) occurred last week on August 29 and lasted for 2 days. It was glorious!!!
Below is the view from our bedroom (facing south) showing a typical bad day, an average day, and a really great day.


On a clear day our view is amazing! And leaves us really appreciating the beauty of this place.
Below are the AQI and PM2.5 readings from the worst day and best day we’ve had since arriving here (using the Air Matters App).


To give you a frame of reference… I follow Austin on my app and Austin’s most polluted day of the year had an AQI reading of 89 (and only 23 days above 50). In comparison, we’ve only had 2 days with average readings under 50.
BUT — our air purifiers rock!
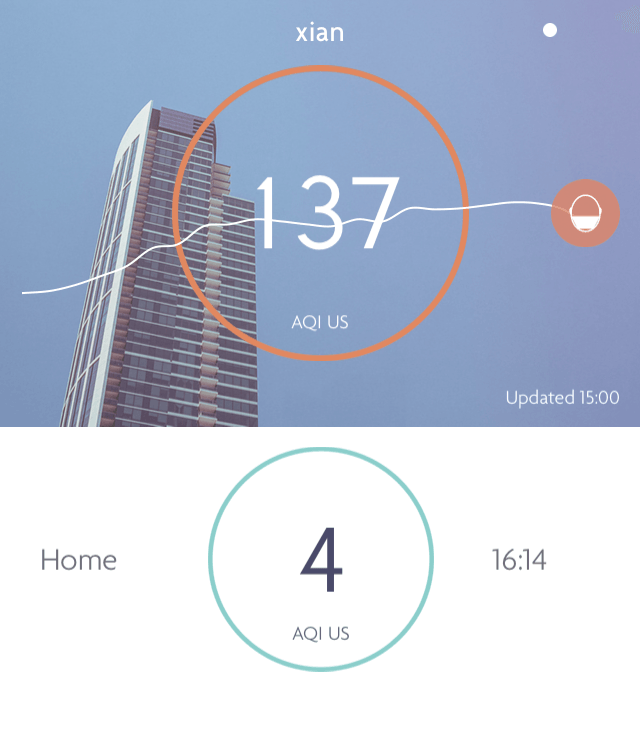
Here is a reading that shows our outdoor AQI with our indoor AQI.
Below shows you one of the purifiers, and the monitor I mentioned.
So whether the day looks like this…

or like this…


we are thankful because we get to breathe in fresh “Texas-like” air everyday 🙂